Smart City Data Platforms: What Local Governments Are Actually Using in 2026

The phrase "smart city" has been circulating in local government circles for over a decade. For much of that time it described an aspiration more than a reality — a future state where sensors, data, and connectivity would transform how cities operated, presented mostly through conference keynotes and federal grant applications rather than operational municipal systems.
That is changing. What is emerging now is different from previous waves of e-government and smart city initiatives. Advances in sensing, data infrastructure, and AI are allowing cities to manage complex systems — transport, energy, water, health, and permitting — not as slow-moving bureaucracies but as continuously operating systems. In effect, parts of the city are beginning to behave like computing platforms: observing conditions in real time, making decisions automatically, and adjusting operations without waiting for human escalation. McKinsey & Company
This article cuts through the marketing language and focuses on what mid-size local governments are actually deploying in 2026 — the platforms, the use cases, the results, and the realistic implementation path for cities that are not San Francisco or Singapore.
Where Most Mid-Size Cities Actually Are
Before discussing platforms and AI applications, it is worth grounding the conversation in operational reality.
Most mid-size American cities in 2026 are not running sophisticated smart city platforms. They are doing something more fundamental and arguably more important — migrating legacy systems to the cloud, standardizing data formats across departments, and building the basic data infrastructure that makes everything else possible.
A city moving its ERP system from on-premise servers to a cloud platform is making a smart city investment — even if it does not look like the sensor networks and AI dashboards that dominate smart city coverage. Cloud migration creates the data accessibility, the integration capability, and the security foundation that every other smart city application depends on. Without it, the more sophisticated tools have nowhere to connect.
It is precisely the least resource-endowed level of government — municipalities — that has become a central testing ground for the practical algorithmization of urban services. Large cities and mid-sized municipalities increasingly integrate AI into everyday administrative routines ranging from permitting and citizen requests to infrastructure management, transportation systems, and emergency services. Industry reports indicate that a majority of U.S. cities with populations exceeding 100,000 residents already employ at least one AI-based solution. arxiv
The practical implication for local government professionals is that smart city capability is not an all-or-nothing proposition. Every city is on a spectrum — and most mid-size cities are further along that spectrum than they realize.
The Four Layers of Smart City Data Infrastructure
Understanding smart city platforms requires understanding the four distinct layers of data infrastructure they sit on top of.
Layer 1 — Data Collection
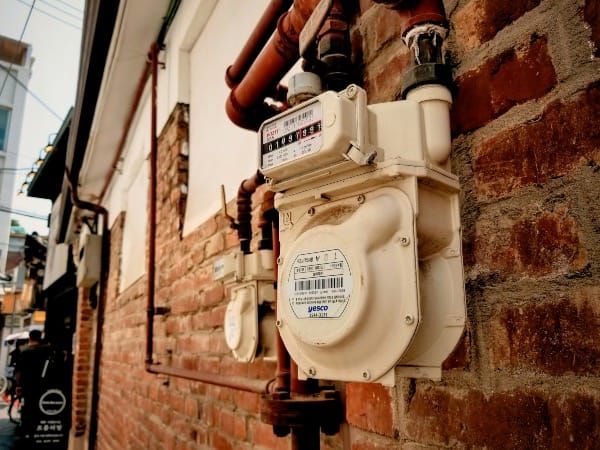
The foundation is sensors, meters, and connected devices that generate real-time data from physical city infrastructure. Smart water meters that can be read remotely and shut off from a computer are a practical and increasingly common example. Traffic sensors, air quality monitors, street light controllers, and building energy management systems are others. Without this layer, smart city analytics has no real-time data to work with.
Layer 2 — Data Integration
Raw sensor data is only useful if it can be combined with operational data from ERP systems, billing platforms, call center applications, and work order systems. This integration layer — often a cloud data platform or an API gateway — is where most mid-size city investments are currently concentrated. Advanced metering infrastructure deployments, like those at the Los Angeles Department of Water and Power, demonstrate how sensor data and operational billing data can be connected at scale. The same principle applies to water utilities of any size connecting smart meter data to billing and customer service systems. McKinsey & Company
Layer 3 — Analytics and AI
With clean, integrated data available, the analytics layer applies machine learning models, statistical analysis, and AI tools to generate operational insights — predictive maintenance schedules, demand forecasts, anomaly detection, sentiment analysis, and pattern recognition across large datasets. This is where the most exciting smart city applications currently live, and where mid-size cities are beginning to pilot meaningful capabilities.
Layer 4 — Operational Response
The final layer closes the loop — turning analytical insights into operational actions, either through automated systems or through dashboards and alerts that direct human decision-making. A water system that automatically flags accounts with unusual consumption patterns, a public works platform that generates work orders based on predicted infrastructure failure probability, or a customer service system that routes calls based on real-time sentiment analysis are all examples of this layer functioning as intended.
If you want a ready-built Excel dashboard tracking these exact KPIs — the Local Government Dashboard Template Pack has you covered at $47.
What Mid-Size Cities Are Actually Deploying: Five Real Use Cases
1. AI-Powered Sentiment Analysis for Customer Service
One of the most accessible AI applications for local government — accessible because it builds on call center infrastructure that most departments already have — is sentiment analysis applied to customer call transcriptions.
Call center platforms increasingly offer automatic transcription of customer interactions. AI models applied to those transcriptions can identify sentiment patterns across thousands of calls — which topics generate the most frustration, which resolution pathways leave customers satisfied, which time periods see elevated negative sentiment that correlates with billing cycles or service disruptions.
For a utility billing department, sentiment analysis transforms call data from a volume metric into a resident experience signal. A spike in negative sentiment around a specific billing period can flag a billing error or a rate change communication failure before the complaint data fully surfaces in formal channels. This is the kind of early warning capability that the operational dashboards discussed in our guide to building KPI dashboards for local government are designed to surface — and AI-powered sentiment analysis extends that visibility into qualitative data that structured metrics alone cannot capture.
2. Predictive Infrastructure Replacement
AI asset management platforms are shifting municipal infrastructure budgeting from fixed annual capital expenditure cycles to dynamic, condition-driven capital allocation — prioritizing investment in assets showing accelerated degradation signals. iFactory
For public works departments, predictive infrastructure analytics means moving beyond the current approach of replacing pipes, roads, and equipment on fixed schedules or after failure — toward data-driven replacement prioritization based on actual asset condition, failure history, and degradation modeling.
The data inputs for this kind of analysis already exist in most municipalities — work order history, infrastructure installation dates, material types, repair frequency, and geographic factors like soil composition and traffic loading. What most departments lack is the analytical infrastructure to combine those data sources and apply predictive models to the result. Cloud ERP migrations are creating exactly that infrastructure — and AI tools built on top of it can identify which assets are most likely to fail in the next three to five years, enabling capital planning that is justified by evidence rather than intuition.
This connects directly to the public works KPIs discussed earlier on this site — specifically the planned versus reactive maintenance ratio, which is the operational metric that predictive AI most directly improves.
3. Lead Service Line Identification for Federal Compliance
One of the most consequential smart city data applications currently underway in American water utilities is AI-assisted lead service line identification — driven by the EPA's Lead and Copper Rule Revisions, which require water systems to identify and replace lead service lines on accelerated timelines.
Most water utilities do not have complete records of their service line materials. Records from installations decades ago are incomplete, inconsistent, or missing entirely. AI models trained on available data — installation dates, geographic location, permit records, property age, historical material usage patterns, and utility connection records — can predict with meaningful accuracy which service connections are most likely to have lead infrastructure, enabling utilities to prioritize field verification and replacement resources efficiently rather than conducting random or purely geographic surveys.
This is a use case where the data your utility billing department already manages — account records, service connection dates, property information — becomes the foundation for a federally mandated compliance program. The housing affordability data and Census demographic data discussed elsewhere on this site are also valuable inputs — lead pipe risk is disproportionately concentrated in older housing stock in lower-income neighborhoods, and overlaying billing system data with Census housing age data and demographic information creates a more complete risk model than any single data source provides alone.
4. Digital Twins for Infrastructure Planning
Digital twins represent real-time digital models of buildings, neighborhoods, or entire cities that, when paired with AI, enable cities to simulate scenarios — what would happen to traffic patterns if a major corridor were closed for construction, or how would heat islands react to additional tree canopy? This allows planners to virtually simulate interventions and select scenarios that reduce costs and acknowledge abrupt social impacts. Techgenyz
Cities using digital twins for capital planning are achieving 30 to 40 percent more efficient infrastructure investment decisions. For mid-size cities, full city-scale digital twins remain largely aspirational — the data infrastructure, technical capacity, and cost requirements are significant. But departmental digital twins — a water distribution network model, a road network simulation, a building energy model — are increasingly achievable and are being piloted by mid-size municipalities. iFactory
The practical starting point for most cities is not a city-wide digital twin but a utility network model that combines GIS infrastructure data, sensor readings from smart meters and pressure monitors, and hydraulic modeling software to simulate how the water distribution system responds to demand changes, main breaks, or new development. This is the kind of application where the GIS and spatial analysis tools discussed in our tool comparison article become genuinely powerful when combined with real-time sensor data.
5. AI-Assisted Permitting and Citizen Services
Cities of all sizes are rapidly adopting LLM-driven AI tools. Cities like Boston, Singapore, and Barcelona are already using AI-powered urban planning platforms to integrate policy, climate, and citizen feedback. Early AI-assisted zoning has improved the ability of municipal planners to test alternative scenarios, integrate regulatory and environmental constraints, and communicate complex design options more clearly to non-technical stakeholders. IDC
For mid-size cities, the most accessible entry point into AI-assisted citizen services is not complex zoning simulation but simpler applications — AI chatbots that handle common resident inquiries about billing, permits, and service requests without requiring a live representative, automated document review that flags incomplete permit applications before they enter the review queue, and natural language interfaces that allow residents to track service requests in plain language rather than navigating complex web portals.
These applications reduce call volume, improve resident experience, and free staff time for higher-complexity interactions — a practical extension of the call center analytics and self-service deflection strategies that data-driven utility departments are already pursuing.
The Platforms Mid-Size Cities Are Actually Using
Rather than enterprise platforms designed for large cities with dedicated smart city teams and eight-figure technology budgets, mid-size cities are deploying smart city capability through three practical pathways.
Cloud ERP Platforms with Analytics Modules
Tyler Technologies, SAP, and Oracle — the dominant government ERP vendors — have all significantly expanded their analytics and AI capabilities in recent years. For cities already running these platforms, the lowest-friction path to smart city analytics is through the analytics modules and AI features built into the platforms they already pay for. Predictive analytics for utility billing, AI-assisted permit review, and automated service request routing are all available within existing ERP contracts for many municipalities — and are underutilized because departments are not aware they exist.
Microsoft Azure and the Power Platform
Microsoft's cloud platform has become one of the most common smart city data infrastructure choices for mid-size cities, largely because most municipalities already run Microsoft 365 and have existing enterprise agreements. Azure IoT Hub provides the connectivity layer for sensor data. Azure Machine Learning provides the AI modeling capability. Power BI — discussed in depth in our PowerBI dashboard guide — provides the operational dashboard layer. And the entire stack integrates with existing ERP systems through standard APIs. For a city already invested in the Microsoft ecosystem, this pathway requires the least new vendor management and the most leveraging of existing relationships.
Open Source and Federal Tools
For departments with technical capacity and constrained budgets, open source tools combined with free federal data platforms provide meaningful smart city analytics capability at minimal cost. Python for data engineering and machine learning, QGIS for spatial analysis, and federal platforms like NOAA's Climate Mapping for Resilience and Adaptation tool and the open data portals covered elsewhere on this site form a capable stack for departments willing to invest in technical skill development rather than software licensing.
The Honest Barriers: What Slows Smart City Adoption
"We're all in learning mode and looking at it with a wary eye," one mayor said about AI's potential for municipal operations. That quote captures the genuine ambivalence many local government leaders feel about smart city technology — interested in the potential, uncertain about the risks, and constrained by the practical realities of municipal budgets and staffing. Smart Cities Dive
Three barriers consistently slow smart city adoption in mid-size cities more than technology cost or technical complexity.
Data quality and integration. Smart city analytics is only as good as the underlying data. Departments that have been managing data in inconsistent formats, across disconnected systems, without standardized identifiers are not ready to layer AI on top. The foundational work of data standardization, system integration, and quality assurance has to happen first — and it is unglamorous, time-consuming work that does not generate press releases.
Organizational capacity. Running smart city platforms requires staff who can manage them. Most mid-size cities do not have dedicated data science teams. The gap between what the technology can do and what existing staff can operate and maintain is a consistent implementation challenge that procurement decisions rarely account for adequately.
Governance and public trust. Smart city success depends not just on adopting AI, but on designing for agility, responsibility, and inclusion. Residents and elected officials have legitimate questions about how AI-generated decisions are made, how data is protected, and who is accountable when automated systems produce incorrect outputs. Cities that have invested in AI governance frameworks — clear policies on data use, algorithmic transparency, and human oversight requirements — are better positioned to deploy smart city technology with community trust than those that treat governance as an afterthought. IDC
A Practical Smart City Roadmap for Mid-Size Cities
For local government professionals trying to move their city's smart city capability forward without an enterprise budget or a dedicated technology team, a realistic three-phase roadmap looks like this.
Phase 1 — Foundation (Current to 18 months)
Complete or accelerate cloud migration. Standardize data formats across departments. Establish a basic data governance policy. Deploy smart metering where not already in place. These are the unglamorous prerequisites that everything else depends on.
Phase 2 — Analytics (12 to 36 months)
Build operational dashboards using existing data. Pilot AI applications in one or two high-value use cases — sentiment analysis on call transcriptions, predictive work order prioritization, or lead service line risk modeling are all practical starting points with achievable ROI. Train existing staff on data tools rather than hiring for roles the budget cannot sustain.
Phase 3 — Intelligence (24 to 60 months)
Expand AI applications across departments based on Phase 2 learnings. Evaluate digital twin capabilities for utility or transportation networks. Develop public-facing transparency dashboards that make smart city data visible and interpretable to residents. Build the governance framework that ensures AI-assisted decisions remain auditable and accountable.
Final Thoughts
The smart city conversation in 2026 has matured past the hype cycle. The question is no longer whether data and AI will transform local government operations — that transformation is underway in cities of all sizes. The question is how to participate in it practically, responsibly, and within the real constraints of municipal budgets and staffing.
The cities making the most meaningful progress are not the ones with the most sophisticated platforms. They are the ones that started with the data they already had, invested in the foundational infrastructure before the glamorous applications, and deployed technology in service of clearly defined resident outcomes rather than in pursuit of smart city branding.
The smart meter pilot, the cloud ERP migration, the call center sentiment analysis experiment — these are not peripheral to the smart city conversation. They are the smart city conversation, happening at the scale that most local government professionals actually work within.
Ready to build dashboards for your department?
The Local Government Dashboard Template Pack includes three Excel dashboards built specifically for city analysts and utility managers — call center performance, utility billing, and public works service requests. Each template comes pre-loaded with fictional data so you can see it working immediately.