Smart Water Metering: What the Data Actually Shows
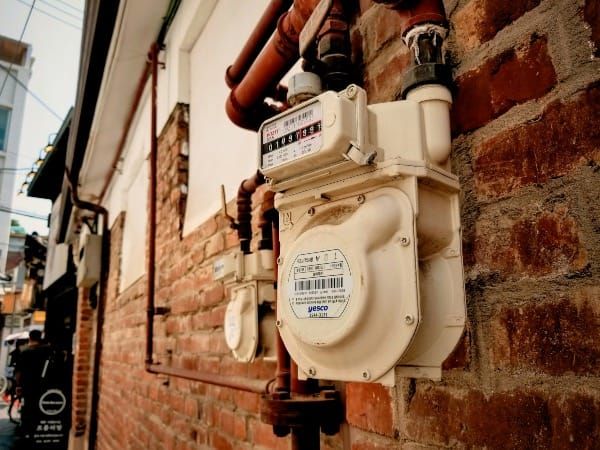
Smart water meters are one of the most discussed technology investments in local government utility management — and one of the most practically impactful ones actually being deployed at scale across mid-size American cities right now.
The conversation around smart metering often stays at the level of capability description: these meters read remotely, they detect leaks, they improve billing accuracy. What gets discussed less frequently is what the data from deployed systems actually shows — the specific operational changes, the quantified cost impacts, and the capital planning insights that utilities gain once Advanced Metering Infrastructure is live and generating data at scale.
This article draws on documented deployments and operational experience to examine what smart water metering data actually reveals — across field operations, customer service, billing accuracy, and infrastructure planning — and what mid-size utilities should realistically expect when they move from pilot programs to full deployment.
What Smart Metering Actually Is
Before examining outcomes, it is worth being precise about terminology. Smart metering in a water utility context typically refers to Advanced Metering Infrastructure — AMI — which is a specific technology architecture distinguishable from earlier automated meter reading systems.
The key distinction is in the comparison between metering generations. Traditional analog meters require manual reading by field personnel visiting each location. Automated Meter Reading — AMR — systems enable remote reading but are one-way: the meter transmits data when queried by a drive-by reader. AMI systems provide automated two-way data sharing between the utility and each meter, transmitting interval data — typically every 15 to 60 minutes — continuously, including continuous flow monitoring, backflow detection, tamper alerts, and critically, remote connect and disconnect capability.
That last capability — remote connect and disconnect — is the operational change that most directly affects utility billing departments. As explored in our guide to smart city data platforms, smart metering is one of the foundational layers of smart city infrastructure — the physical sensing layer that generates the real-time data that every other smart city analytics application depends on.
What the Field Operations Data Shows
The most immediate and quantifiable operational benefit of smart metering is the elimination of truck rolls for meter reading, service connection, and service disconnection.
In a traditional water utility, meter reads require field crews to visit every customer location on a regular cycle — monthly, bi-monthly, or quarterly depending on the service area. A large utility conducting monthly reads may have dozens of meter readers driving hundreds of miles each month to collect data that a smart meter transmits automatically every hour. Albuquerque's Water Authority, which has been deploying AMI meters progressively, documented that with nearly half of their meters on AMI technology, they reduced their meter reading vehicle fleet by half — from 48 vehicles to 24 — with corresponding reductions in fuel consumption, vehicle maintenance costs, and employee time previously spent on physical reads.
The operational impact extends beyond meter reading to service connections and disconnections. In a traditional utility, turning service on or off for a new connection, a move-out, or a non-payment disconnection requires dispatching a field crew to the physical meter location. A crew member drives to the address, turns the meter on or off, documents the action, and drives to the next location. That truck roll has a fully loaded cost — labor, vehicle, fuel, scheduling overhead — that ranges from $30 to $150 per visit depending on the utility's cost structure and the distance traveled.
AMI meters with remote connect and disconnect capability eliminate that truck roll entirely. A billing representative who previously submitted a work order and waited for a field crew to execute a turn-off can now disconnect service from a computer in seconds — and reconnect it just as quickly once payment is received. For a utility processing hundreds of turn-ons and turn-offs per month, the cumulative labor and vehicle cost savings are substantial. The same representative can process more transactions in less time, with no field crew involvement required for routine connect and disconnect actions.
This operational shift has a secondary benefit that is less often quantified but equally real: it changes the nature of the work order backlog for field crews. As covered in our public works work order dashboard guide, work order backlogs accumulate when incoming volume exceeds the department's capacity to respond. Eliminating routine meter read visits and standard connect/disconnect work orders from the field crew queue frees capacity for the work orders that genuinely require physical presence — infrastructure repairs, meter replacements, inspection visits — without adding staff.
What the Billing and Customer Service Data Shows
AMI meters generate hourly or sub-hourly consumption data for every account in the service area. That data density fundamentally changes the billing dispute resolution process — and the underlying billing accuracy that drives dispute volume.
Traditional meters bill customers for the aggregate consumption measured between manual reads — typically one month's total usage summarized in a single number. When a customer receives a bill that seems unusually high, the billing representative's options are limited: look at the prior month's read, compare it to the current read, and calculate whether the meter reading is plausible. If the customer claims they were away for two weeks and could not have used that much water, the traditional billing system has no way to verify or refute that claim with precision.
AMI data changes that entirely. Access to high-frequency historic data on customer water use allows representatives to identify the dates of high-usage events and ask follow-up questions to identify common causes — filling a swimming pool, a leak, unusual occupancy — or help diagnose potential problems that contribute to high bills. A representative can pull the hourly consumption profile for a customer's account, identify the specific dates and times when elevated usage occurred, and have a precise, data-supported conversation about what likely happened and what the options are.
Albuquerque's Water Authority documented the practical impact: in 2019, the utility flagged 99 accounts with continuous water usage through AMI monitoring and helped 78 of those customers fix the source of the problem — typically a leak — saving 42,000 gallons of water per hour across those accounts. Customers who would previously have received an unexpectedly high bill, disputed it, and consumed billing staff time on a resolution process instead received a proactive alert and assistance fixing the underlying problem before the high bill was even generated.
That proactive intervention model — identifying the problem before the bill — represents a meaningful shift in the customer service function. As discussed in our utility billing complaint reduction guide, the most effective complaint reduction strategies address the upstream conditions that generate complaints rather than managing complaints reactively after they arrive. AMI data gives billing departments the upstream visibility to do exactly that.
Billing accuracy also improves under AMI because estimated readings — the estimates that utilities generate when a manual read is missed, inaccessible, or falls outside an expected range — are eliminated. AMI meters transmit actual consumption data continuously. There are no missed reads, no estimated bills, no corrections required when an estimated read proves inaccurate. The reduction in billing adjustment work orders, re-billing costs, and customer service calls related to estimated readings is a direct operational efficiency gain that accrues from the first billing cycle after AMI deployment.
What the Leak Detection Data Shows
Non-revenue water — the water a utility treats, pumps, and distributes but does not ultimately collect revenue for — represents one of the largest financial drains in water utility operations. Nationally, approximately 6 billion gallons of treated water are lost to leaks daily across the United States, according to the EPA. For an individual utility, non-revenue water losses of 15 to 30 percent of total production are not uncommon in systems with aging pipe infrastructure.
AMI meters detect leaks through two mechanisms. Customer-side leaks — the slow drip or running toilet that a resident does not notice — are identified through continuous flow monitoring that flags accounts showing flow during hours when no usage is expected. A toilet flapper that fails at 2 AM shows a continuous low-level flow that would be invisible on a monthly billing statement but is immediately apparent in hourly AMI data.
Research on AMI leak detection found that on average, AMI-enhanced messaging reduced end-use water consumption by 5.24 gallons per household per day — and in households with observed leaks, the intervention reduced daily water use by 30 gallons per household per day, generating annual savings of approximately $60 per affected household. While the full-system payback period for AMI deployment is longer when measured only through leak reduction in average households, the impact on the subset of households with active leaks is immediate and significant.
Distribution-side leaks — breaks and losses in the utility's own pipe network — are identified through district metering and pressure monitoring that AMI infrastructure supports. By analyzing flow patterns across defined distribution zones and comparing inflow measurements to outflow measurements, utilities can identify sections of the distribution network where losses exceed expected levels — a signal that a leak exists somewhere in that zone before it surfaces as a visible main break or pressure complaint.
What the Capital Planning Data Shows
The capital planning implications of AMI data are the least immediately visible benefit and arguably the most strategically significant over a ten to twenty year horizon.
Traditional water utility capital planning relies on infrastructure age, material type, historical break frequency, and engineering judgment to prioritize pipe replacement and equipment investment. These inputs are valuable but incomplete — age tells you how old a pipe is, not how degraded it actually is, and break frequency is a lagging indicator that captures failures after they occur.
AMI data adds a real-time operational layer to that planning foundation. Pressure patterns in the distribution network reflect the physical condition of the infrastructure carrying the water. Unusual pressure fluctuations can indicate developing main weaknesses before they progress to breaks. Consumption patterns across a service area reveal demand concentrations that inform where capacity constraints will emerge as population grows.
As explored in our Census data and water infrastructure guide, combining Census population growth projections with actual consumption data from AMI systems gives utility planners a more complete demand forecasting model than either data source provides independently. Census data projects how many people will be in the service area. AMI data shows how much water those people are actually using — which varies significantly by housing type, lot size, climate, and conservation behavior in ways that per-capita average assumptions do not capture.
AMI also becomes the data infrastructure for the predictive maintenance applications discussed in our AI and water infrastructure cost reduction guide. Machine learning models that predict equipment failure probability require historical operational data — pressure readings, flow measurements, consumption patterns — at the frequency and granularity that AMI systems generate. A utility that deploys AMI today is simultaneously building the data foundation that makes meaningful predictive maintenance analytics possible in three to five years.
The Realistic Implementation Picture for Mid-Size Cities
The documented benefits above come from fully deployed AMI systems. The path from pilot program to full deployment involves real implementation challenges that mid-size utilities should plan for honestly.
Data volume and storage. AMI systems generating hourly reads across tens of thousands of accounts produce data volumes that exceed what most utility billing systems were designed to handle. A 30,000-account AMI deployment generating hourly reads produces 720,000 data records per day. Managing, storing, and making that data accessible for billing and analytics purposes requires infrastructure investment that is often underestimated in initial AMI business cases.
Integration with existing billing systems. AMI data is only as valuable as the billing system's ability to use it. A meter that generates hourly consumption data is limited in its customer service benefit if the billing platform can only display monthly totals. Integration between the AMI head-end system and the customer information system — the database that billing representatives use to manage accounts — is the technical work that unlocks the customer service benefits described above. Most ERP platforms used in local government can be integrated with AMI systems, but the integration project is a real cost and timeline item.
Customer communication. The transition from estimated or monthly-read billing to AMI billing changes the customer experience in ways that require proactive communication. Customers who have received estimated bills for years may notice changes when actual AMI reads produce different figures. Transparent communication about what the system does, how it handles unusual usage, and how customers can access their own consumption data prevents the billing inquiries and complaints that can otherwise spike during the transition period.
Field crew transition. Eliminating routine meter reading visits and standard connect/disconnect truck rolls does not immediately reduce headcount — it changes what field crews do. The utilities that manage this transition most successfully are those that plan in advance for how freed field capacity will be redeployed toward higher-value activities: infrastructure inspection, proactive maintenance, and the more complex field work orders that AMI enables by freeing the simpler ones.
What to Track Once AMI Is Deployed
The operational benefits of AMI deployment are only visible if you track the right metrics before and after implementation. Establishing baselines before deployment allows you to document the actual impact — which matters both for internal justification of the investment and for grant reporting if federal or state infrastructure funds contributed to the project.
Key metrics to baseline before deployment and track after:
Field operations: Monthly meter reading labor hours, number of truck rolls for connect/disconnect, average cost per truck roll, vehicle miles driven for meter operations.
Billing accuracy: Percentage of bills requiring correction, volume of estimated reads, number of billing-related customer service calls per thousand accounts.
Customer service: Call volume related to high bill disputes, average handle time for billing disputes, number of leak-related billing adjustments issued.
Non-revenue water: Monthly production volume versus metered consumption, estimated non-revenue water percentage, number of leak detections per month.
Capital planning: Pressure complaint frequency by distribution zone, break frequency by pipe segment, demand concentration mapping updated with current AMI consumption data.
These metrics belong on a utility operations dashboard that gives department leadership and city management the ongoing visibility into AMI performance that justifies the investment and identifies where the system is delivering value. As demonstrated in our guide to building KPI dashboards for local government, tracking operational metrics before and after a major system change is the analytical practice that transforms an infrastructure investment from a cost center into a documented improvement program.
Final Thoughts
Smart water metering is not a technology trend. It has become the modern standard for water utilities and helps create a smarter, more responsive and more sustainable water system for the community. Mid-size cities deploying AMI today are not early adopters — they are joining a transition that has been underway for over a decade and is now accelerating as costs decrease and federal infrastructure funding makes deployment financially accessible for utilities that previously could not justify the investment.
What the data from deployed systems consistently shows is that the operational benefits are real and quantifiable — field crew efficiency, billing accuracy improvement, leak detection savings, and capital planning intelligence — but they accrue fully only to utilities that plan the implementation carefully, integrate AMI data with their existing billing and operations systems, and track the right metrics before and after deployment.
The meters are only half the investment. The data strategy is the other half.
Ready to track your utility's operational KPIs?
The Local Government Dashboard Template Pack includes a fully built Utility Billing Performance Dashboard in Excel — pre-loaded with fictional data, all formulas verified, and a setup guide included. Connect your billing system export and your dashboard is live in under 30 minutes.